Navigating Business Outcomes with Data Scenarios in Amazon QuickSight

Author: Manasa K, Head Data Practice | Co-Author: Priyanka Gopalakrishnan
Intuition alone isn’t enough for critical business decisions. Amazon QuickSight Scenario Analysis enables businesses to explore multiple outcomes, predict future scenarios, and assess their impact — all through an intuitive, AI-driven interface.
Just like in chess, anticipating the next move is crucial. But in business, the stakes are higher, requiring data-backed foresight to model situations, evaluate risks, and make confident choices. Data Scenario in Amazon QuickSight provides a powerful way to visualize and compare different outcomes, enhancing decision-making.
In our previous blogs, we explored Amazon Q in QuickSight, Amazon Q Business integration with QuickSight, and AWS Data Stories. Now, let’s dive into how Data Scenarios in QuickSight is offering a different perspective for business analytics, enabling a smarter approach to uncertainty.
What is Data Scenarios in Amazon QuickSight?
Data Scenarios allow you to explore “what-if” situations. It helps you understand what could happen if certain things change in your business. For example, you can ask, “What if sales increase by 10%?” QuickSight will show you how that change might affect your results, helping you make better decisions.
How Data Scenarios Work?
Traditionally, analyzing complex business scenarios required specialized training and extensive time spent with spreadsheets or other tools. QuickSight scenario eliminates this by guiding users with step-by-step analysis. It suggests possible business scenarios, automatically evaluates data, and summarizes findings with actionable recommendations.
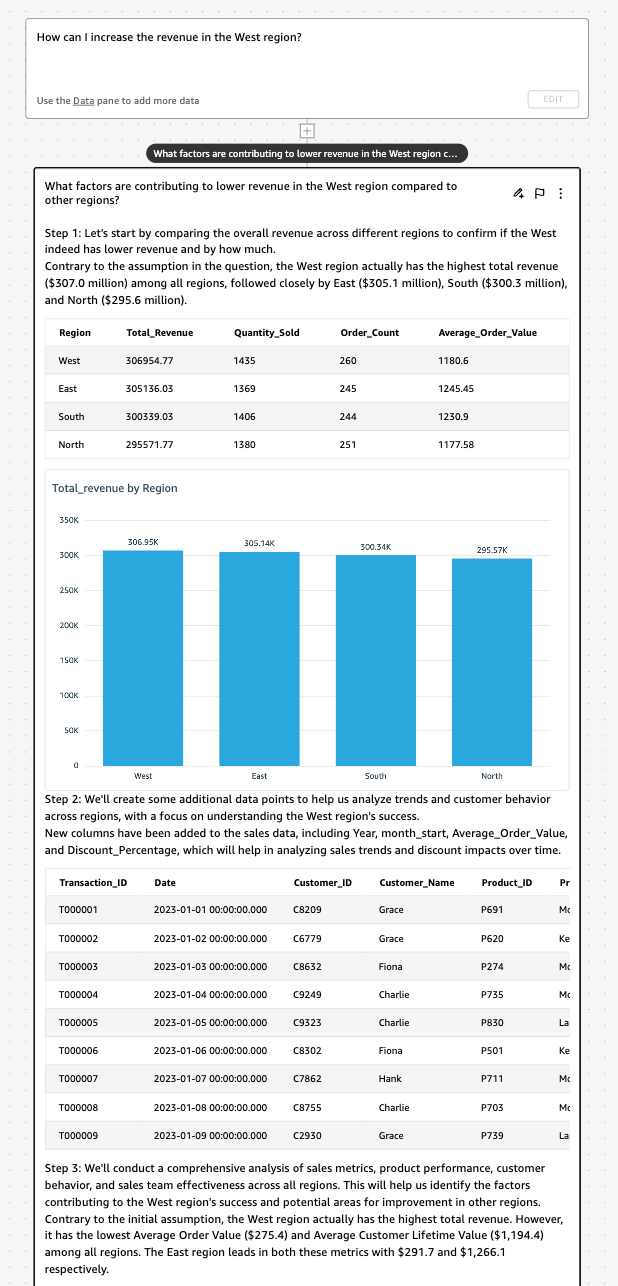
For example, let’s say you’re managing sales across multiple regions. Using Scenario in QuickSight, you could ask: “What strategies can help increase sales in the West region to match the performance of the East region?” Data Scenario feature helps in conducting analysis and presents results with visuals and actionable insights. Users can explore multiple paths simultaneously on an intuitive canvas, adapting the analysis as needed.
How to create Scenarios
Now that we have established scenarios is a groundbreaking feature that businesses can rely on to test different possibilities and explore how changes will affect your business, let us look into how to create them.
- Currently, this feature is in Beta and needs to be enabled from Preview Manager in QuickSight
- Once enabled, you can access Data Scenarios on the Home Page panel along with datasets, dashboards and so on
- Choose New Scenario

- Add Data: Upload a file from local system or select visuals from existing dashboards with pre-configured datasets
- Enter a prompt describing the use case or query we want to analyze and and click Start Analysis

- Your prompt on sales related data can be Why did sales drop in April? How can I increase revenue in West Region? and so on
- Start the analysis to generate insights based on your input
- As you click on Start Analysis, a thread will be initiated and it provides you with suggestions for detailed analysis

On choosing a suggested prompt or writing a custom input describing what we want to analyze, it generates a variety of possible visuals with detailed insights. It starts by understanding the data, identifying the reasons for losses and provides insights on how to mitigate them. Additionally, it uncovers patterns, highlights key contributing factors, and suggests actionable recommendations to improve outcomes.
Note: PDF format is currently not supported when uploading a file in Scenarios.
The scenario feature opens ways to conduct more comprehensive analysis and follow-up queries providing more dynamic and interactive ways to explore data. While working with multiple datasets and follow-ups was possible before, the scenario analysis feature streamlines and enriches these capabilities. Let’s look into them in detail here:
Analyzing Data from Multiple Files in Data Scenarios
When working with multiple datasets, such as Sales Data and Airline Overbooking Analytics, the scenario analysis capability can intelligently identify the relevant dataset based on the question asked.
For instance, if we go with earlier question, “How can I increase the revenue in the West region?”, it will automatically analyze the appropriate dataset (in this case, Sales Data), generate all possible visuals, and provide actionable suggestions to help boost revenue in the West region.
Comprehensive Understanding of Your Data with Follow-ups
With the scenario analysis capability, you can seamlessly ask follow-up questions to dive deeper into your analysis. Each analysis block comes with a “thread” option, allowing you to expand upon the previous insights without starting over.
For example, after asking, “What factors are contributing to the lower revenue in the West region compared to other regions? ,you might want to follow up with:
- “Which products contributed the most to the revenue in the West region?”
- “What was the impact of discounts on profits in this region?”
By simply clicking the thread option below the analysis block, you can explore related questions, refine your insights, and build a comprehensive understanding step by step. This intuitive interaction streamlines your analytical journey, saving time and ensuring focus on actionable outcomes.
Potential Challenges and Pitfalls
While the scenario analysis capability offers powerful insights by retrieving data based on your prompts, there are some limitations when working with multiple datasets:
- Lack of Dataset Source Identification
When providing answers, the scenario does not specify the dataset or file name from which the data was retrieved. For example, if you have datasets like Sales Data and Airline Overbooking Analytics, and you ask, “How can I increase revenue in the West region?”, the response will present visuals and insights without clarifying whether the information was sourced from Sales Data or Airline Overbooking Analytics. This can lead to ambiguity, especially when analyzing results across multiple datasets.
- Ambiguity with Common Columns
If two datasets contain identical or similarly named columns (e.g.,Region,Revenue,Profit), the system may struggle to determine which dataset to prioritize for retrieving the data. For instance, when both datasets have a Region column, the scenario analysis might mix data or provide answers without accurately identifying the correct source, leading to potential errors or irrelevant insights.
- Longer Data Rendering Time
When dealing with large datasets or complex scenarios in business intelligence tools, one common challenge is data rendering time — the time it takes for the system to process, load, and display results. In this case, the rendering process is taking 20–30 seconds, which is relatively high and can impact user experience, productivity, and decision-making efficiency.
It’s important to note here that while this feature is still in its Beta version and may present some challenges, Data Scenarios has the potential to significantly transform the business analytics landscape with further evolution.
Conclusion
Amazon QuickSight’s scenario analysis feature marks a transformative advancement in business analytics, making complex ‘what-ifs’ analysis accessible to users through its natural language interface. The future of business intelligence looks promising, paving the way for even more intuitive and powerful analytical tools. As these technologies evolve, organizations can look forward to even more sophisticated ways to turn their data into actionable insights.
Amazon Q Business integration with QuickSight effectively overcomes the limitations of traditional BI tools in analyzing unstructured data. Want to learn how to use Q Business with QuickSight for a more holistic approach to analysis of your data? Check out our previous blog Embracing GenBI with Data Stories and Amazon Q Business Integration with QuickSight by Manasa K and Sruthi.